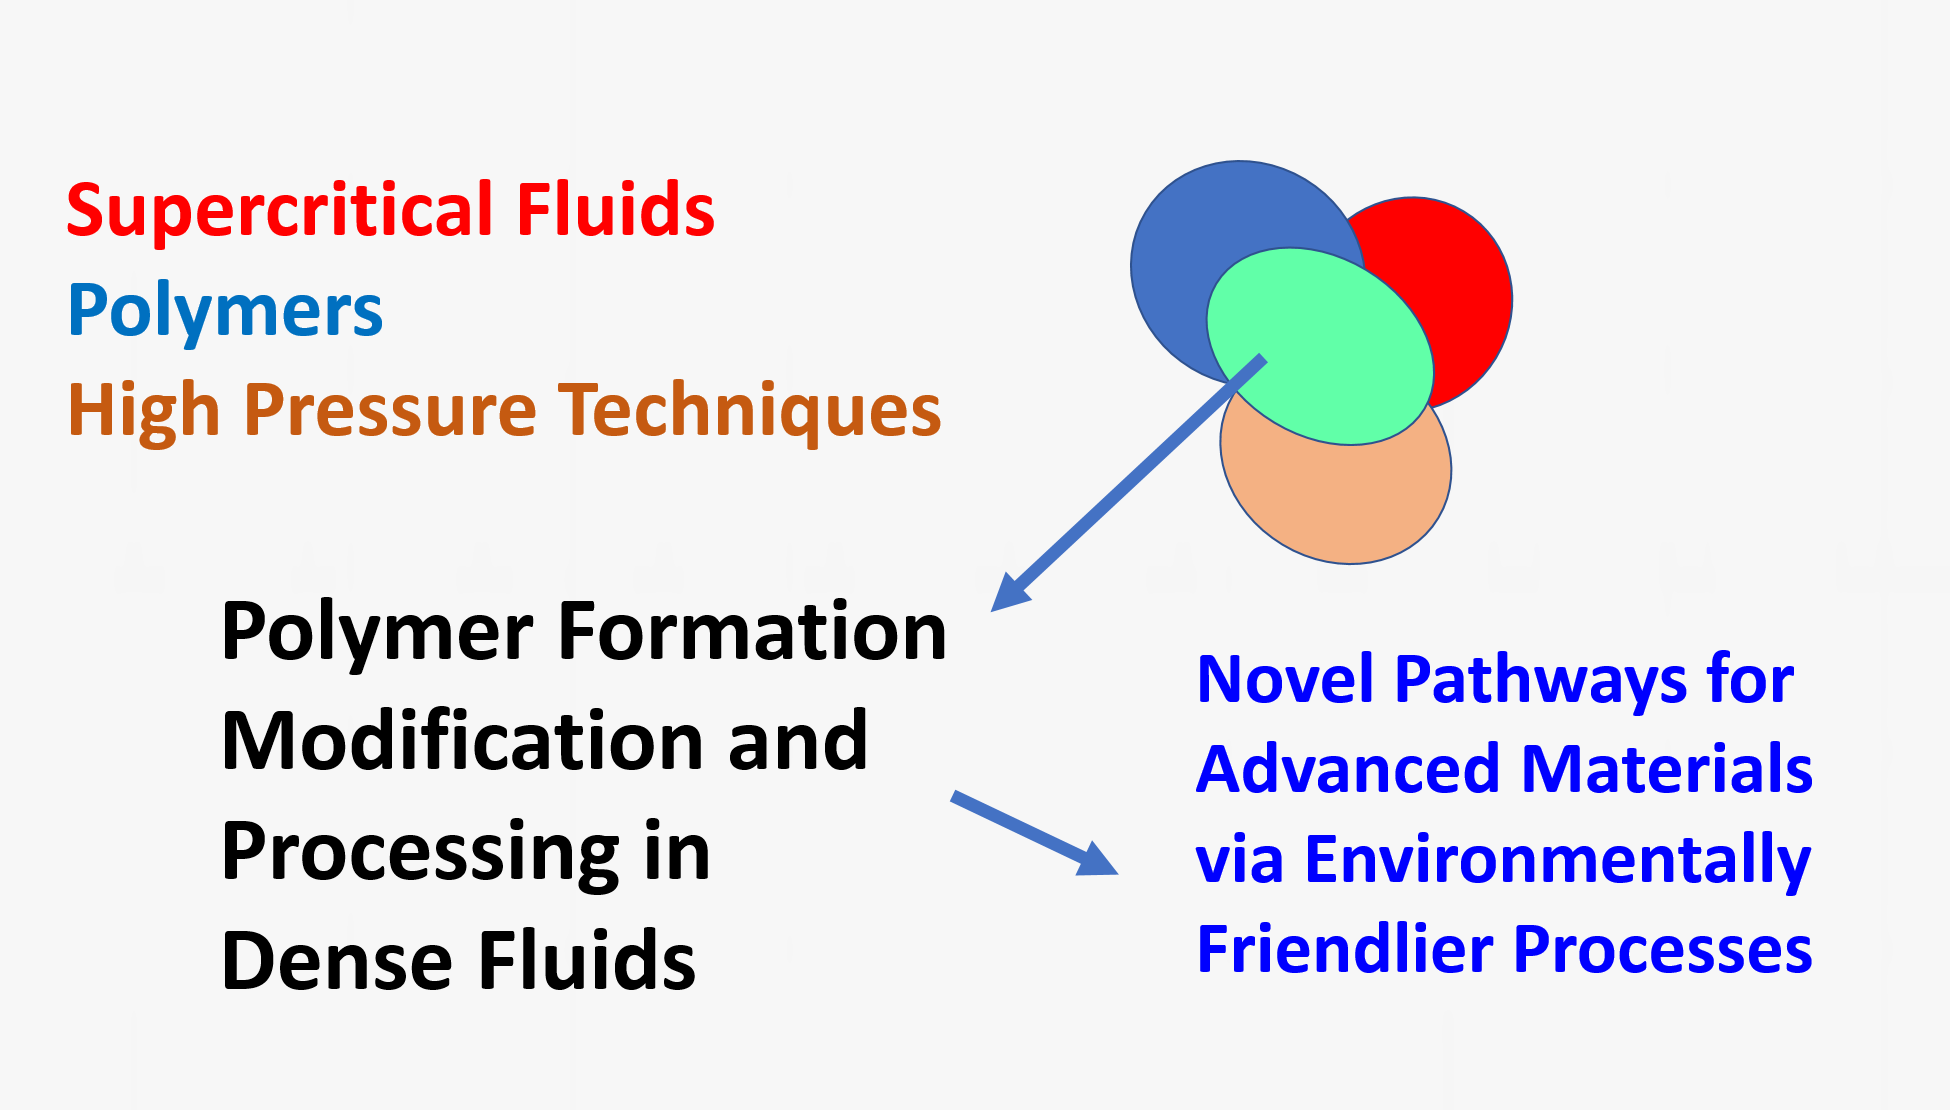
Research Program

Supercritical or Dense Fluids

At the vapor-liquid critical point, the distinction between the liquid and vapor phase disappears. The fluid enters a homogeneous state in which properties (density, diffusivity, viscosity) become adjustable between the gas- and liquid-like values without entering the two-phase region.

Fluid mixtures display critical points that are in between the critical points of the individual components which depend on the composition.  Simple mixtures display a continuous critical line.   

Phase diagram of a pure substance showing the vapor (V), Liquid (L), solid (S), and the supercritical fluid (SCF) regions. TP is the triple point. CP is the critical point. In fluid mixtures, critical point is composition dependent. In simple binary mixtures, it is continuous (red dashed curve) between the critical point of component 1 (CP1) and component 2 (CP2).
Carbon Dioxide going through its critical point as observed in a high-pressure view-cell equipped with sapphire windows. From left to right: Supercritical carbon dioxide displays a red glow when illuminated from the back side of the window as it approaches the critical point, then becomes pitch black as it crosses the critical point and phase separates into vapor (white color) and liquid phase (light yellow), displaying the Vapor-Liquid phase boundary below the critical point


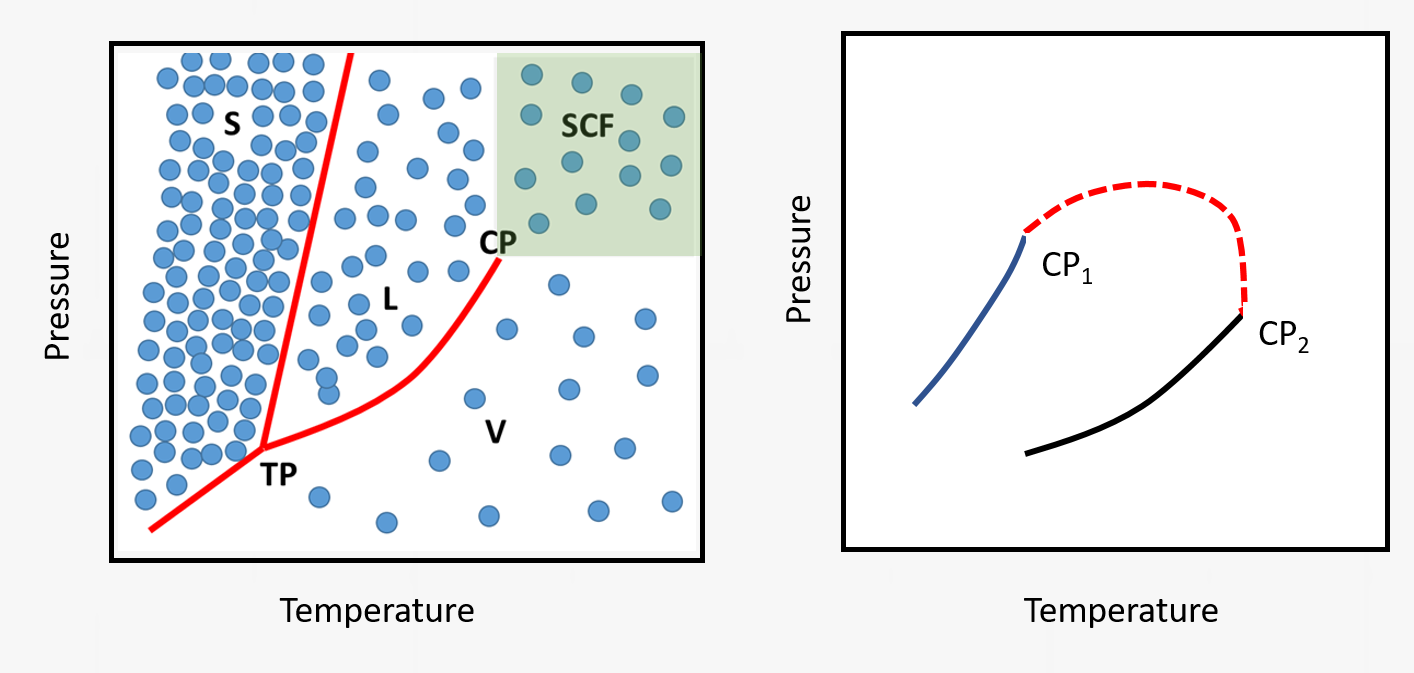
Altering the properties of supercritical fluids and fluid mixtures using pressure, temperature, or fluid composition as tuning parameters provide unique opportunities for a range of targeted applications.  One such property of high practical importance is the solubility parameter.


Solubility parameters of compressed cyclohexane (left) a mixture of cyclohexane with carbon dioxide (middle), and carbon dioxide (right). (Please note the differences in the y-axis scales and the ranges of the values).

Broad Research Program Objective

The primary interest in Professor Kiran’s research group is understanding the thermodynamic and transport properties and dynamics of physicochemical transformations in systems at high pressures for applications pertaining to polymer modifications and processing in or with supercritical / or compressed dense fluids. 

Image of lab research areas


Systems for the Assessment of Phase Boundaries, Miscibility, and Phase Separation

Assessment of these boundaries are critical in applications related to polymer synthesis, separation, purification, impregnation, and particle or fiber formation processes.

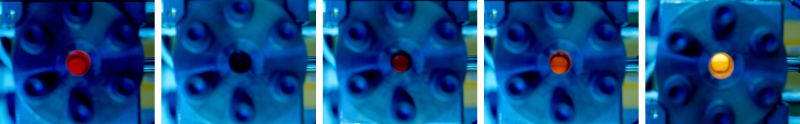
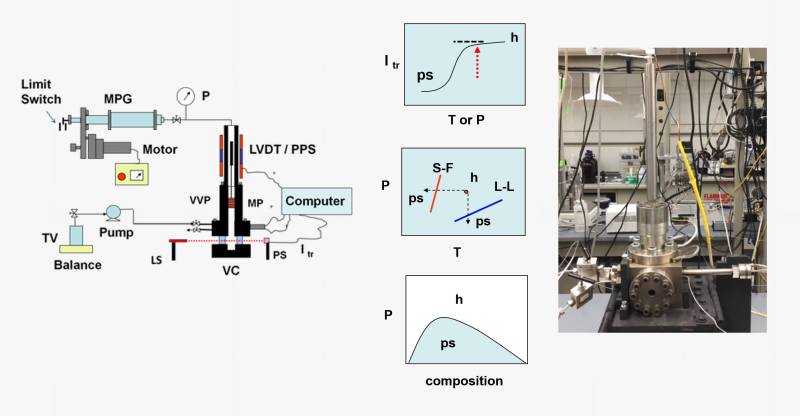
We employ high-pressure variable-volume view-cells for investigations of the phase state and volumetric properties of fluids, fluid mixtures, and polymer solutions at pressures up to about 60 MPa and temperatures up to 180 oC.

The view-cells are custom designed and are equipped with (a) movable pistons to change the volume and thus the pressure and (b) sapphire windows to observe the cell content to assess the phase state and the pressure-temperature conditions associated with phase boundaries.

One of these systems is shown in the figure below.  The miscibility and demixing conditions are determined either visually, or optically by measuring the variation of transmitted light intensity at different T and P conditions. Measurements carried out at different polymer concentrations may allow for the generation of pressure-composition (or temperature-composition) diagrams showing the homogeneous one-phase solution (h) and phase-separated (ps) domains.

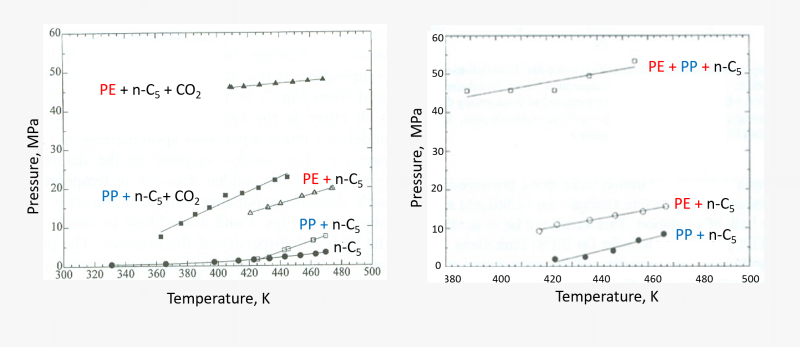
Phase boundaries of polymers are assessed in pure compressed fluids, as well as in mixtures such as an organic solvent plus carbon dioxide. An example of this is shown below for the miscibility boundaries for 3 wt % solutions of polyethylene and polypropylene in n-pentane (n-C5) and an n-pentane + CO2 mixture with 70 wt % n-pentane, and 10 wt % solutions in n-pentane.   

Single piston variable-volume view-cell with motorized pressure generator (PGN), LVDT position sensor. (MP = movable piston, I tr = transmitted light) and the assessment of the phase boundary (liquid-liquid (L-L), or solid-fluid (S-F)) from the change in the transmitted light intensity when phase separated (ps) domains are entered form  homogeneous (h) solution conditions.
Single piston variable-volume view-cell with motorized pressure generator (PGN), LVDT position sensor. (MP = movable piston, Itr = transmitted light) and the assessment of the phase boundary (liquid-liquid (L-L), or solid-fluid (S-F)) from the change in the transmitted light intensity when phase separated (ps) domains are entered form homogeneous (h) solution conditions.
Left: Miscibility boundaries for 3 wt % polyethylene (PE) or 3 wt % polypropylene (PP) solutions in n-pentane (n-C5), or in a mixture of n-pentane with CO2 (70 wt % pentane). The n-C5 curve is the vapor pressure curve for n-pentane; Right: Miscibility boundaries of 10 wt % polyethylene, or 10 wt % polypropylene, or a  10 wt % (PE + PP) mixture (consisting of 5 wt % PE + 5 wt % PP) in n-pentane.
Left: Miscibility boundaries for 3 wt % polyethylene (PE) or 3 wt % polypropylene (PP) solutions in n-pentane (n-C5), or in a mixture of n-pentane with CO2 (70 wt % pentane). The n-C5 curve is the vapor pressure curve for n-pentane; Right: Miscibility boundaries of 10 wt % polyethylene, or 10 wt % polypropylene, or a 10 wt % (PE + PP) mixture (consisting of 5 wt % PE + 5 wt % PP) in n-pentane.

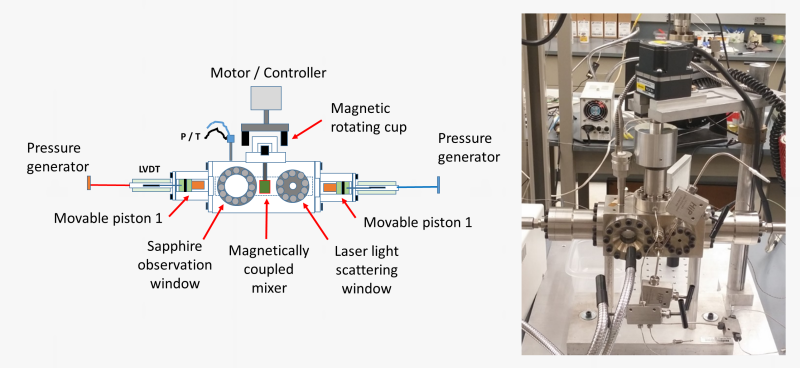
A more advanced version of the variable-volume view cell that we employ is a dual-piston system with magnetically coupled mixer that allows explorations of phase boundaries in very viscous polymer solutions.

This system has an additional pair of sapphire windows to carry out laser-light scattering experiments to assess the dynamics of phase separation and elucidate if the phase separation proceeds by nucleation and growth (NG) or by spinodal decomposition (SD) mechanism. This is done by measuring the angular distribution and the time evolution of the scattered light intensities during phase separation.

This unique experimental system and the phase separation dynamics in solutions of poly(ε-caprolactone) in a dense fluid mixture of acetone + CO2 are illustrated in the figures below. 

Dual-Piston variable-volume view-cell with additional windows for light scattering studies.
Phase boundaries and the dynamic of phase separation of poly(ε-caprolactone) in a mixture of acetone + CO2 mixture (2:1 wt/wt ratio). The time evolution and angular distribution of the light scattering patterns show that 5 and 25 wt % solutions undergo phase separation by nucleation and growth but 12 wt % solution by spinodal decomposition.

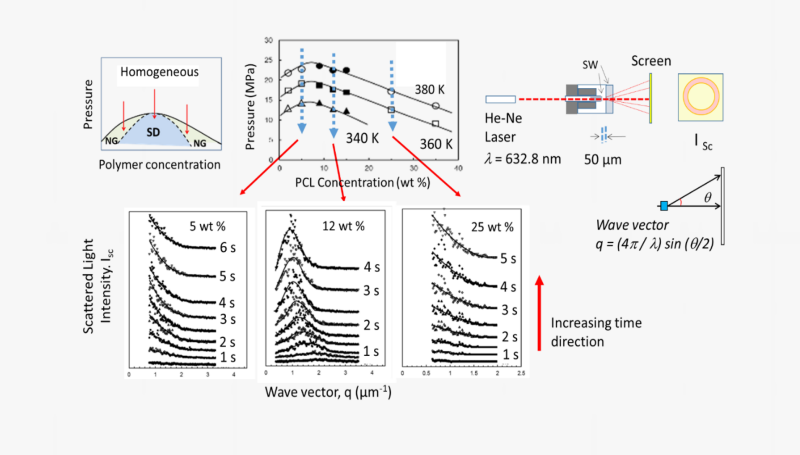
These assessments have important practical implications. If phase separation is carried out at concentrations lower than the critical polymer concentration, polymer particles are formed via NG mechanism. Phase separation at concentrations higher than the critical polymer concentration will lead to the formation of porous materials, or foams also via NG mechanism. Phase separation at the critical polymer concentration proceeds by spinodal decomposition and results initially in a co-continuous phase which, if can be arrested, can lead to the formation of interconnected networks.

Systems for Assessment of Transport Properties - High Pressure Viscosity 

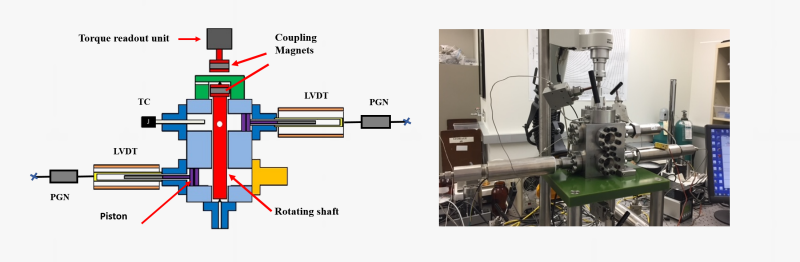
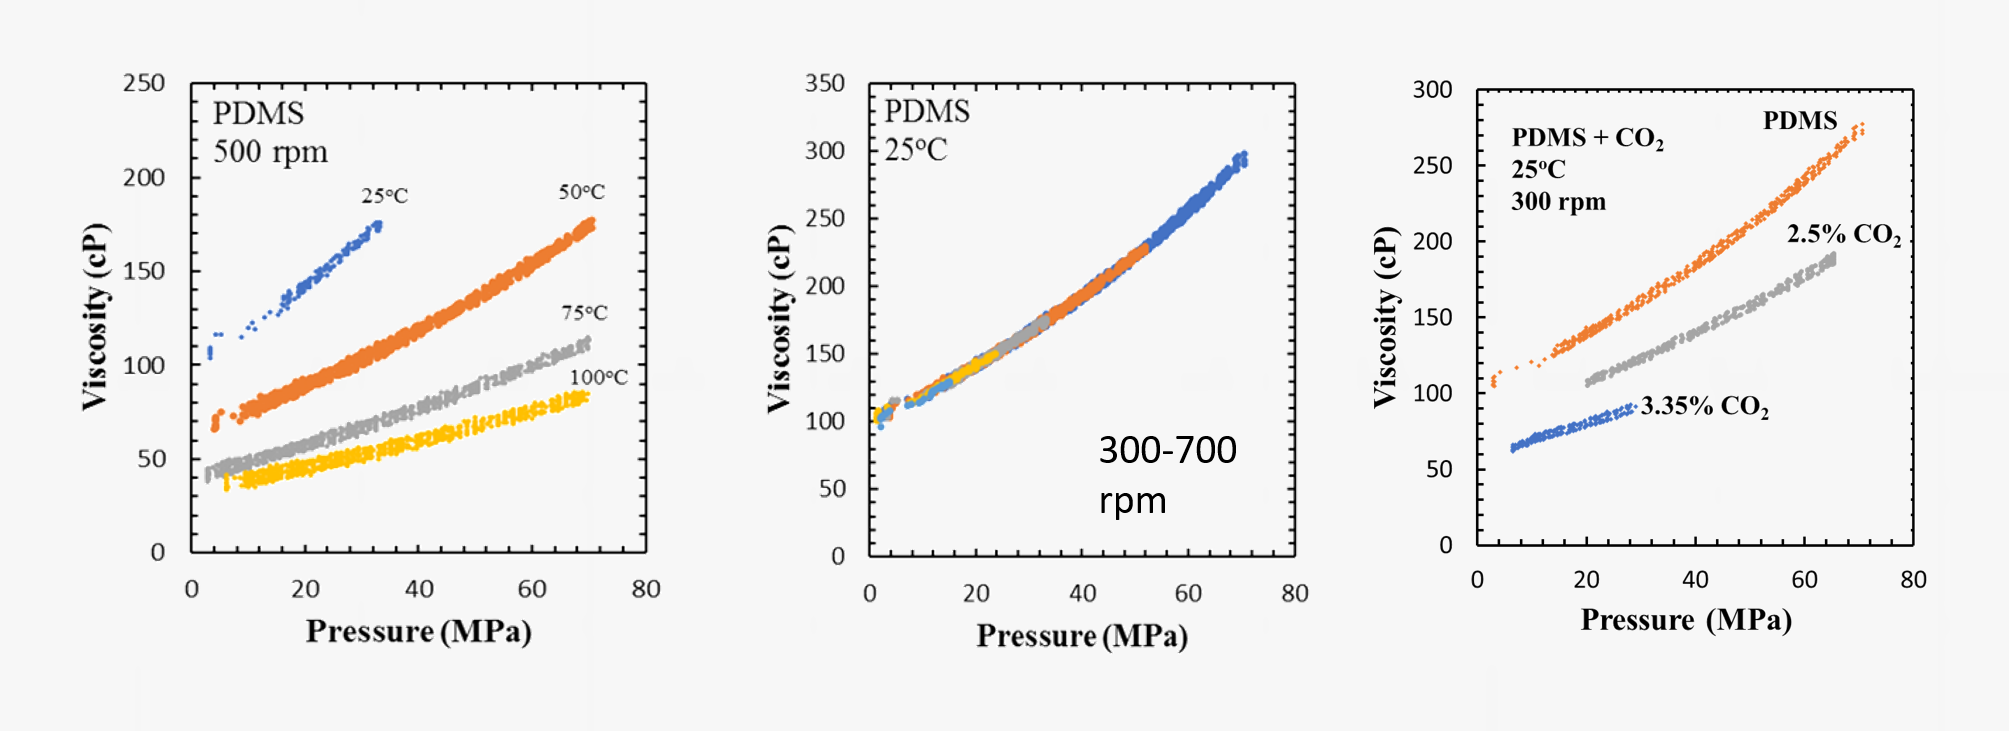
Our laboratory is equipped with a specially designed high-pressure rotational viscometer. This is also a dual-piston dual sapphire-window system. Viscosities of polymer solutions can be determined as a function of shear rate at pressures up to 60 MPa. This system and some data on the viscosity of polydimethylsiloxane (PDMS) and PDMS + CO2 mixtures are shown in the figures below. Sorption of supercritical fluids like CO2 in polymers often lead to significant reductions in the viscosity of polymers. 

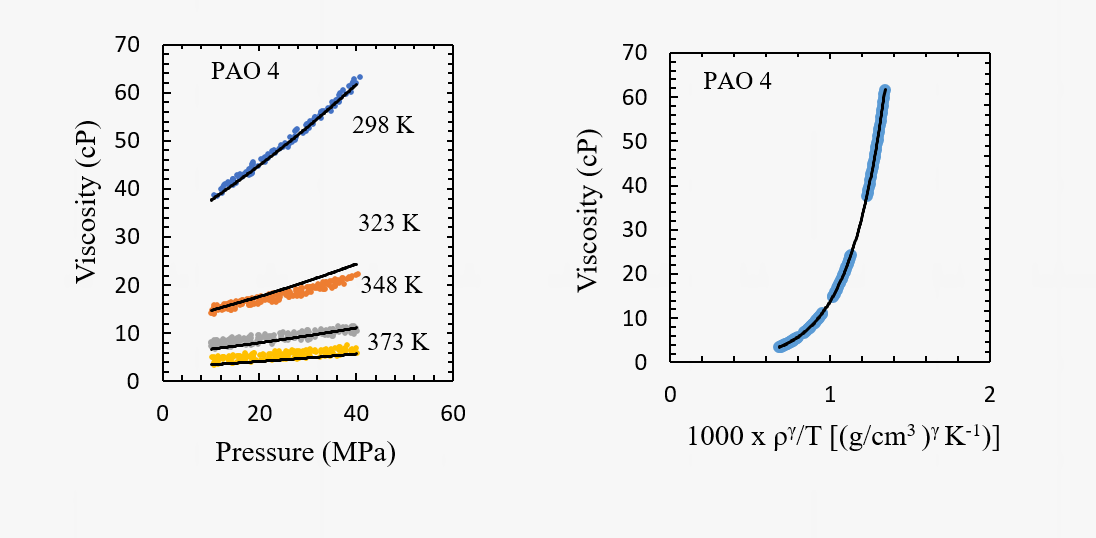
The viscosity measurement system is effective also in assessing the pressure and temperature dependence of viscosity of automotive lubricants and transmission fluids. An example for a poly(alpha olefin) base oil is also shown below. 


High-pressure rotational viscometer
Viscosity of a polydimethylsiloxane (PDMS) sample (MW = 6,000) as a function of temperature, pressure and rotational speed, and reduction of its viscosity with dissolution of CO2
Viscosity of a poly(α-olefin) base oil (PAO 4) lubricant as a function of temperature and pressure. The data for different temperatures collapse to a master curve if plotted as a function of ρϒ/T where ϒ is the scaling parameter as suggested by the density scaling theory. We have the capability to experimentally measure the density at these temperatures and pressure to generate such plots.


Systems for Assessment of Thermal Transitions and Rigidity 

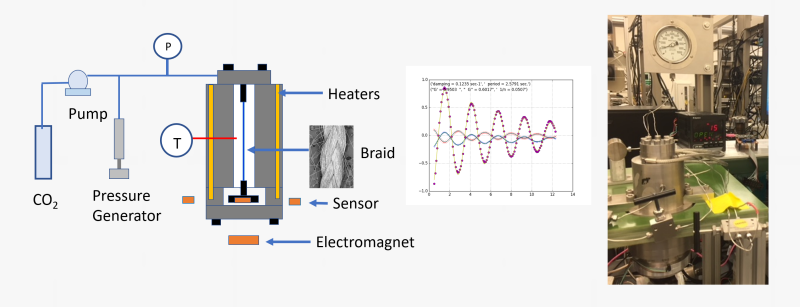
We employ a unique powerful technique developed in our laboratory to assess the changes in the thermal transitions (such as the glass transition temperature Tg or the melting temperature Tm) when a polymer is exposed to a supercritical fluid like carbon dioxide. We refer to this technique as the High-Pressure Torsional Braid Analysis (HP-TBA). It involves a glass braid impregnated with the polymer of interest which is suspended in a high-pressure chamber and attached to an inertial mass. An external electromagnet is used to initiate an oscillation of the inertial mass and the time decay of oscillations are recorded and analyzed to generate information on relative rigidity and mechanical damping. Thermal transitions are then identified from the change in the rigidity and the mechanical damping index.

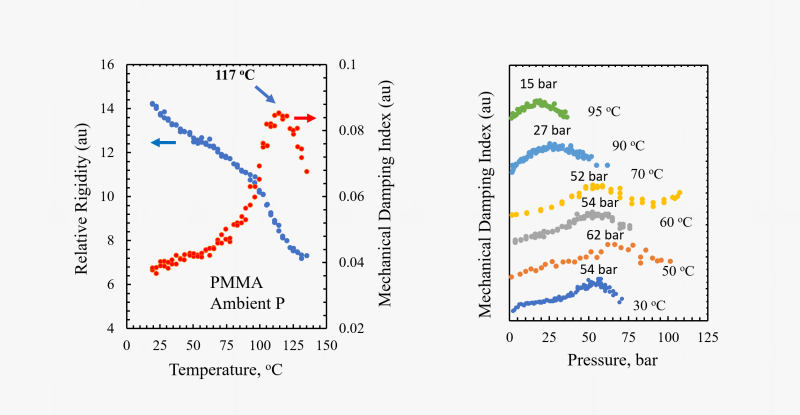
The HP-TBA system and the changes in the relative rigidity and mechanical damping index for poly(methyl methacrylate) (PMMA) determined by this technique are shown at ambient pressure as a function of temperature, and at a set of selected temperatures as a function of carbon dioxide pressure. As the polymer approaches its glass transition temperature, the onset of long-range chain motions leads to a decrease in rigidity and an increase in mechanical damping. The maximum in the mechanical damping is then taken as the glass transition condition. With dissolution of carbon dioxide in the polymer, chain motions are facilitated and Tg is depressed.  

High Pressure Torsional Braid Analysis (HP-TBA) System.
Glass transition temperature of PMMA at ambient pressure, and how it changes in CO2. While at ambient pressure Tg is assessed to be around 117 oC for this PMMA sample, it is reduced to about 90 oC if exposed to CO2 at 15 bar, and to 60 oC if it were exposed to CO2 at 54 bar.


Systems for Polymer Modifications - Foaming of Polymers with Carbon Dioxide

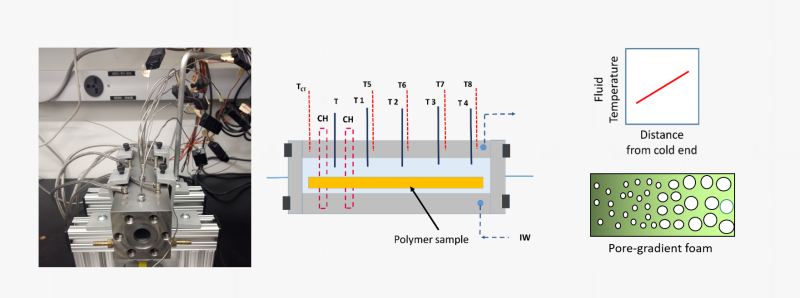
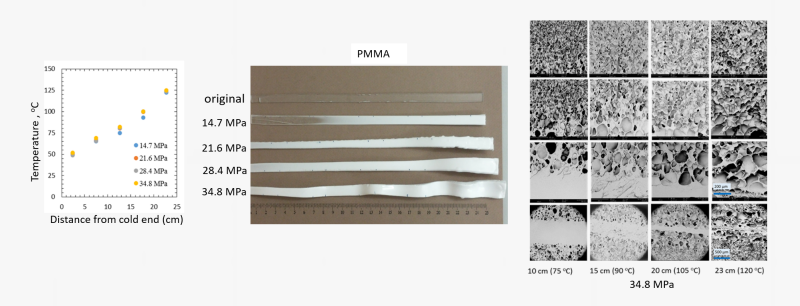
A range of unique capabilities exist for foaming and generating micro- or nano-porous polymer networks in supercritical fluid media. The facilities permit either free-foaming explorations or confined foaming within molds with porous walls. A unique capability is the foaming cell that allows conducting foaming experiments under a temperature gradient at a fixed pressure. Figure below shows the gradient foaming cell and examples foams produced in this cell. 

Gradient foaming cell that allows a quick assessment of the feasibility of foaming at a given pressure, but at a range of different temperatures in just one experiment.
Foaming of poly(methyl methacrylate) (PMMA) in the gradient foaming cell at different pressures. The SEM images show the morphology of the foam generated at 34.8 MPa at cross-sections corresponding to the different positions which were at different temperatures in the foaming cell.

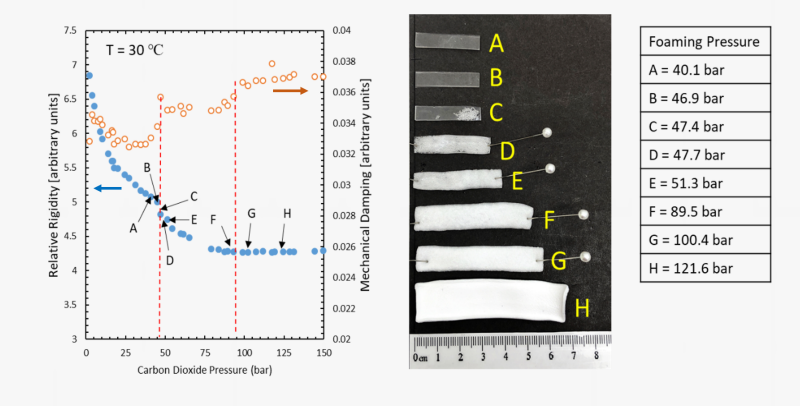
Foaming with physical blowing agents is a complex process that requires knowledge on the sorption level of the gas, shifts in the thermal transition temperatures and the rigidity or melt viscosity pf the polymer among many other factors. We employ the information generated from HP-TBA analyses to make rational selections for the foaming pressures and temperatures. Figure below shows the foaming of a rubbery polymer along the rigidity reduction path as a function of CO2 pressure. 

Foaming of rubbery copolymer poly(ethylene-co-vinyl acetate-co-carbon monoxide) in CO2 along the rigidity reduction path as a function of CO2 pressure